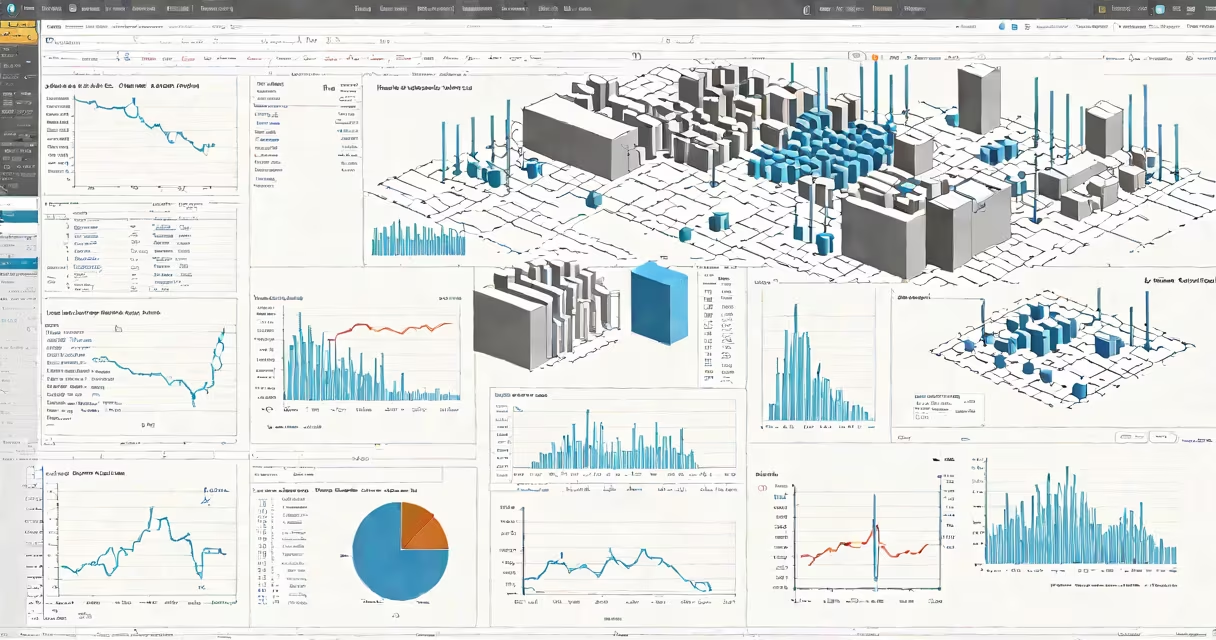
Analytics in Python refers to the process of extracting meaningful patterns, trends, and insights from structured or unstructured data using Python programming tools and statistical methods. It combines data manipulation, visualization, and modeling to support informed decisions in fields like finance, healthcare, and marketing.
Python's strength in analytics lies in its rich system of specialized libraries. The core stack includes pandas for data cleaning and transformation, NumPy for numerical operations, Matplotlib and Seaborn for visualizing distributions and relationships, and scikit-learn for building predictive models. These tools handle everything from importing CSV files to generating interactive dashboards.
For example, a retail analyst might load monthly sales data into a pandas DataFrame, calculate month-over-month growth rates, plot trends using Seaborn, and then use scikit-learn to forecast next quarter's demand based on historical patterns. This entire workflow runs in a single Jupyter Notebook file, enabling reproducible, shareable analysis.
Every analytics task in Python follows a consistent pipeline: data ingestion, preprocessing, exploration, modeling, and reporting. Data enters via files (CSV, Excel), databases (SQL), or APIs. Pandas handles most of the initial loading and reshaping, allowing users to filter rows, rename columns, and fill missing values with minimal code.
After preparation, analysts explore data through summary statistics and visualizations. A call to df.describe() returns count, mean, standard deviation, min, and max for numeric columns. A simple df.plot(kind='bar') generates a bar chart showing product category performance. These steps identify outliers, trends, and anomalies before formal modeling begins.
Modeling involves applying algorithms to predict outcomes. For instance, a logistic regression model trained on customer demographics and purchase history can estimate the likelihood of churn. The model's accuracy is evaluated using metrics like precision, recall, and F1-score-calculated automatically by scikit-learn functions.
The following table outlines major libraries used in analytics in Python and their primary functions:
| Library | Primary Function | Common Use Case |
|---|---|---|
| pandas | Data manipulation and analysis | Filtering customer records by region and date range |
| NumPy | Numerical computation | Calculating correlation coefficients between variables |
| Matplotlib | Basic plotting | Generating line graphs of daily website traffic |
| Seaborn | Statistical visualization | Creating heatmaps of feature correlations |
| scikit-learn | Machine learning | Training a classifier to detect spam emails |
Each library integrates smoothly. You can pass a pandas DataFrame directly into a Seaborn function or feed a NumPy range into a scikit-learn estimator. This interoperability reduces friction during analysis.
One non-obvious distinction: pandas handles tabular data efficiently, but it's not designed for high-performance computing. For large datasets exceeding RAM capacity, users switch to Dask or Vaex, which extend pandas syntax to distributed or out-of-core processing. This avoids memory errors when working with terabyte-scale logs.
Analytics in Python supports diverse domains. In healthcare, researchers analyze electronic health records to track disease progression. A study published in *Nature Digital Medicine* used Python to model the spread of respiratory infections across regions, adjusting for vaccination rates and population density.
In e-commerce, companies use analytics to personalize recommendations. Amazon's recommendation engine relies on collaborative filtering algorithms implemented in Python. By analyzing millions of past purchases and browsing behaviors, it suggests products likely to interest individual users.
I once built a tool to monitor social media sentiment for a small business. Using the TextBlob library, I processed 10,000 customer tweets, scored each for positivity/negativity, and plotted daily sentiment trends. The dashboard revealed a spike in negative feedback after a product recall announcement-information that helped the company respond faster.
Analytics in Python is not synonymous with machine learning. While ML is a subset of analytics, many tasks don't require models. Descriptive analytics-summarizing past events-relies only on aggregation and visualization. Calculating average order value or identifying peak sales hours falls under analytics but doesn't involve training algorithms.
It's also not limited to experts. Tools like Jupyter Notebooks make it easy for beginners to experiment. A student learning basic statistics can run a t-test on group differences using scipy.stats with just three lines of code. The barrier to entry is low compared to proprietary software like SPSS or SAS.
A common misconception is that analytics requires massive datasets. In reality, small datasets often yield clear insights. Analyzing 50 survey responses with simple counts and percentages can reveal user preferences, especially when combined with qualitative context.
To begin, install the core packages using pip: pip install pandas numpy matplotlib seaborn scikit-learn. Start with a simple dataset, such as the Iris flower dataset available in scikit-learn. Load it with from sklearn.datasets import load_iris, then use pandas.DataFrame to view the features and targets.
Run a quick analysis: compute the mean petal length for each species, create a boxplot, and test whether the difference between species is statistically significant using a t-test. This end-to-end workflow demonstrates how analytics in Python turns raw numbers into actionable understanding.
Analytics in Python is not just a technical skill-it's a way of thinking. It turns ambiguity into clarity, noise into signal, and guesswork into evidence-based action. Whether predicting sales or diagnosing system failures, the structure empowers users to act with confidence.