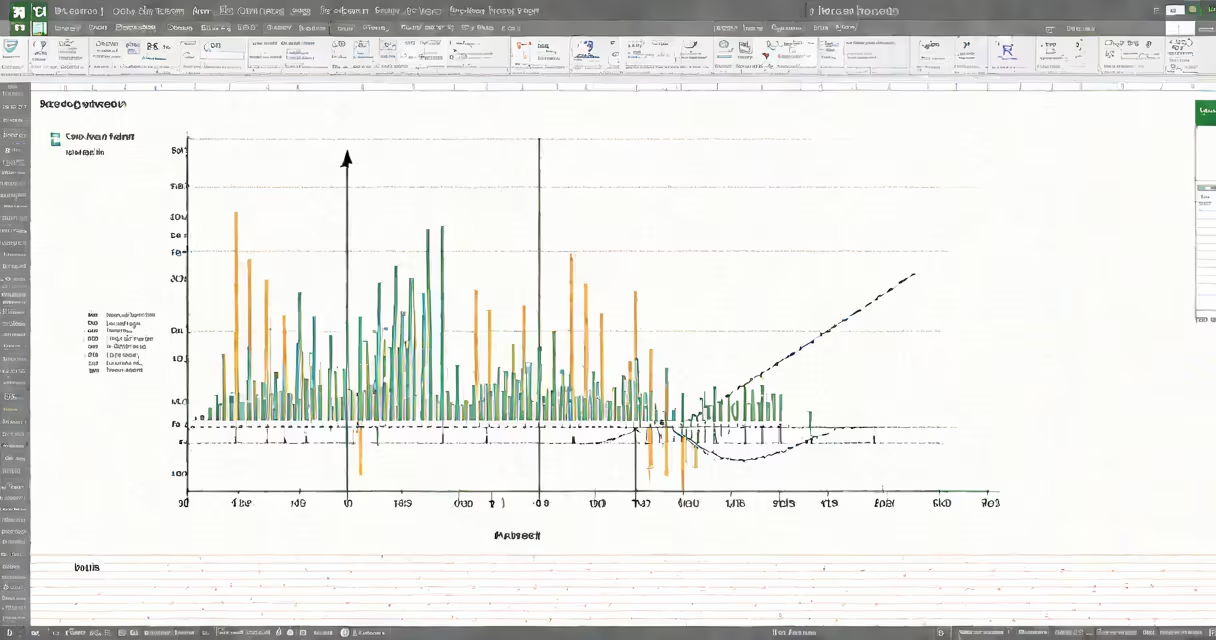
Calculating regression in Excel involves using built-in functions and tools to model the relationship between one dependent variable and one or more independent variables, producing an equation that predicts outcomes based on input data. This process supports forecasting, trend analysis, and hypothesis testing within spreadsheets.
Regression in Excel uses statistical methods to fit a line through data points, minimizing the sum of squared residuals. The most common form is linear regression, which assumes a straight-line relationship between variables. Excel provides multiple ways to perform this: the LINEST function, Data Analysis ToolPak, and chart trendlines. Each method returns coefficients, R-squared values, and standard errors essential for interpreting model accuracy.
For example, a sales manager analyzing monthly advertising spend versus units sold can use regression to determine how much each $100 spent increases sales. With 12 months of data, Excel calculates a slope (e.g., 1.8 units per $100 spent) and intercept (e.g., 12.4 units when spending is zero). This model allows forecasting future sales based on planned ad budgets.
Linear regression models the relationship between two variables using the equation y = mx + b, where y is the predicted outcome, x is the input, m is the slope, and b is the y-intercept. Excel computes these values automatically using algorithms that minimize error across all data pairs.
The core mechanism relies on the least squares method, which finds the line that reduces the total vertical distance between each data point and the fitted line. This minimizes prediction error across the dataset. For multiple predictors, Excel extends this to multivariate regression, adjusting for interactions and correlations among inputs.
When data is noisy or contains outliers, Excel's regression tools still provide estimates, but users must validate assumptions. A residual plot-showing differences between actual and predicted values-reveals patterns indicating poor fit. If residuals form a clear curve, a linear model may not suit the data.
Excel offers several approaches to calculate regression, each suited to different levels of expertise and use cases. The choice depends on whether you need quick insight, detailed diagnostics, or integration into larger workflows.
| Method | Best For | Output | Complexity |
|---|---|---|---|
LINEST function |
Programmatic analysis, changing models | Range of coefficients, R², standard errors | High |
| Data Analysis ToolPak | Detailed statistical reports | Full ANOVA table, confidence intervals, residuals | Medium |
| Chart trendline | Visualizing trends, quick estimates | Equation, R² shown on chart | Low |
Using LINEST requires entering the function as an range formula. For example, with advertising spend in column A (A2:A13) and sales in B2:B13, typing =LINEST(B2:B13,A2:A13,TRUE,TRUE) and pressing Ctrl+Shift+Enter returns an range with slope, intercept, R², and standard errors. This method integrates easily into dashboards and automated reports.
The Data Analysis ToolPak, enabled via File > Options > Add-ins, provides a structured interface. Selecting "Regression" opens a dialog where you define input Y and X ranges, choose output options, and specify confidence levels. The resulting report includes ANOVA tables, F-statistics, and p-values-critical for assessing whether the model explains significant variation in the dependent variable.
Adding a trendline to a scatter plot is the simplest route. Right-click a data series in a chart, select "Add Trendline," then choose "Linear." Check "Display Equation on Chart" and "Display R-squared Value." This visual method suits exploratory work but lacks detailed diagnostics.
Many users assume that a high R-squared value (e.g., above 0.8) indicates a valid model. This is incorrect. R-squared measures how well the model fits the data, not whether the relationship is causal or meaningful. A high R-squared can result from overfitting or spurious correlations.
A critical but often overlooked point: regression assumes independence of observations. If data points are time-series and correlated across periods (e.g., monthly sales influenced by prior month's performance), standard regression produces misleading results. In such cases, autoregressive models or time-series-specific tools are required.
I once analyzed quarterly revenue data from a retail chain using Excel's regression tool. The model showed a strong positive correlation between store size and sales (R² = 0.91). However, upon closer inspection, larger stores were mostly located in urban areas with higher foot traffic. The real driver was location, not size. This highlighted the risk of omitting confounding variables-a flaw known as omitted variable bias.
Businesses use calculating regression in Excel to forecast demand, evaluate marketing ROI, and assess employee performance. A marketing team might regress customer acquisition cost against conversion rates across campaigns to identify efficient channels.
For accurate results, ensure data meets basic assumptions: linearity, homoscedasticity (constant variance of residuals), normality of residuals, and no multicollinearity (when using multiple predictors). Use diagnostic plots-residuals vs. fitted values-to detect violations.
Always test the model on unseen data. Split your dataset into training (e.g., 80%) and testing (20%) sets. Build the model on training data, then apply it to test data to measure prediction error. A large drop in R-squared between training and test sets suggests overfitting.
When working with multiple predictors, avoid including highly correlated variables. High correlation inflates standard errors and makes coefficient interpretation unstable. Use correlation matrices or variance inflation factors (VIF) to detect redundancy.
Finally, remember that regression is a descriptive tool, not a causal one. Correlation does not imply causation. Just because advertising spend correlates with sales doesn't mean increasing ads causes higher sales-other factors like seasonality or competitor actions may be involved.