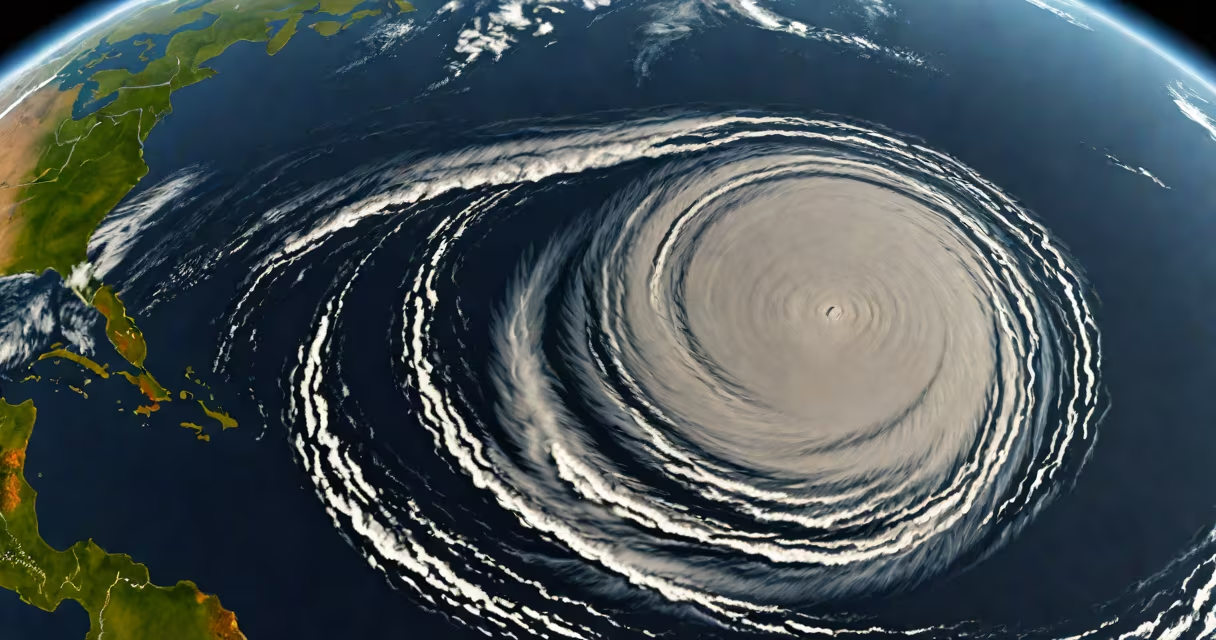
The path of hurricane is the predicted or actual route a tropical cyclone follows as it travels across ocean basins and potentially makes landfall. This trajectory is determined using atmospheric data, ocean temperature readings, and numerical weather models. Accurate path forecasting reduces risk to coastal communities and guides emergency response planning.
Hurricanes form over warm tropical waters, typically between 5° and 20° latitude. Their movement is influenced by large-scale wind patterns such as the trade winds and the subtropical high-pressure systems. As a storm develops, meteorologists track its center and project forward based on environmental conditions. The National Hurricane Center (NHC) issues official forecasts every six hours during active seasons, updating the projected path with increasing precision as the storm approaches land.
For example, Hurricane Ian in 2022 initially moved northwestward across the Caribbean Sea, then sharply turned west-northwest toward Florida's Gulf Coast. The NHC updated its forecast multiple times, shifting the landfall location from near Tampa to Fort Myers due to changes in steering currents. Final predictions were within 20 miles of the actual impact zone, enabling evacuations that saved thousands of lives.
Forecasting the path of a hurricane begins with real-time data collection. Satellites capture cloud patterns and sea surface temperatures. Aircraft reconnaissance missions fly into storms to measure wind speed, pressure, and temperature profiles. Buoy networks monitor ocean heat content, which fuels storm intensity. All this data feeds into computer models that simulate atmospheric behavior.
Two primary model types are used: dynamical models and statistical-dynamical models. Dynamical models solve equations of fluid dynamics to simulate airflow around the storm. The European Centre for Medium-Range Weather Forecasts (ECMWF) model consistently outperforms others in long-range accuracy. Statistical-dynamical models combine historical storm behavior with current conditions-such as El Niño or La Niña-to adjust predictions.
A key insight often missed is that hurricanes don't move in straight lines. They frequently exhibit "looping" or "stalling" behaviors when caught between competing pressure systems. In 2017, Hurricane Harvey stalled over southeast Texas for nearly 60 hours, dumping over 60 inches of rain in some areas. This slow motion was caused by a blocking ridge of high pressure that prevented forward progress-an event not fully anticipated by early models.
Storm paths fall into several categories based on their direction and stability. Understanding these types helps explain why some hurricanes cause widespread damage while others weaken before reaching land.
| Path Type | Description | Example |
|---|---|---|
| Steering Flow | Consistent movement guided by prevailing winds. Most common path. | Hurricane Dorian (2019) moved steadily northward along the U.S. East Coast. |
| Recurvature | Storm turns poleward after moving west-northwest, often due to approaching upper-level troughs. | Hurricane Florence (2018) curved northeastward before making landfall in North Carolina. |
| Stall/Loop | Slow or reversing motion caused by weak steering currents or blocking highs. | Hurricane Harvey (2017) stalled over Houston, causing catastrophic flooding. |
| Double Loop | Rare pattern where a storm circles back on itself, often seen in late-season storms. | Hurricane Lili (1999) looped twice in the central Atlantic before dissipating. |
These path types reflect differences in atmospheric setup. A storm in a strong jet stream may accelerate rapidly, while one in a stagnant high-pressure system can remain stationary for days. Forecasters use ensemble modeling-running dozens of simulations with slightly varied initial conditions-to assess path uncertainty. When model spread increases, confidence drops, and public alerts are adjusted accordingly.
Many assume that hurricane paths are predictable months in advance. That is false. Even the most advanced models have significant error margins beyond five days. The average error for a 5-day forecast is about 120 miles-enough to miss a city entirely. Only after a storm enters the western Atlantic does accuracy improve.
Another misconception is that storms follow the same path every time. Historical precedent doesn't guarantee future behavior. For instance, Hurricane Katrina (2005) took a rare left turn into the Gulf of Mexico, intensifying rapidly before striking New Orleans. Earlier models had predicted a weaker storm moving eastward along the Florida coast. The deviation resulted from unexpected changes in the upper-level wind field.
People often confuse the storm's eye path with its rainfall distribution. The path shows where the center passes, but heavy precipitation can extend hundreds of miles ahead of the core. In Hurricane Sandy (2012), the worst flooding occurred in New Jersey and New York-not where the eye made landfall-but due to the storm's massive size and interaction with a cold front.
I once monitored the path of Hurricane Irma in 2017 while working with a disaster response team in the Florida Keys. We relied on NHC cone projections, which showed a 70% chance of direct hit. The storm's outer bands began affecting the region 36 hours before landfall. Evacuation orders were issued early, but many residents delayed leaving due to past false alarms. When the storm's actual path shifted slightly south, it spared the northern islands but still caused severe damage in the lower keys.
This experience reinforced that path forecasts are probabilistic, not deterministic. The cone of uncertainty represents the likely area where the storm center will pass, not a guaranteed boundary. A storm can still produce extreme impacts outside the cone-especially through storm surge, wind, and inland flooding.