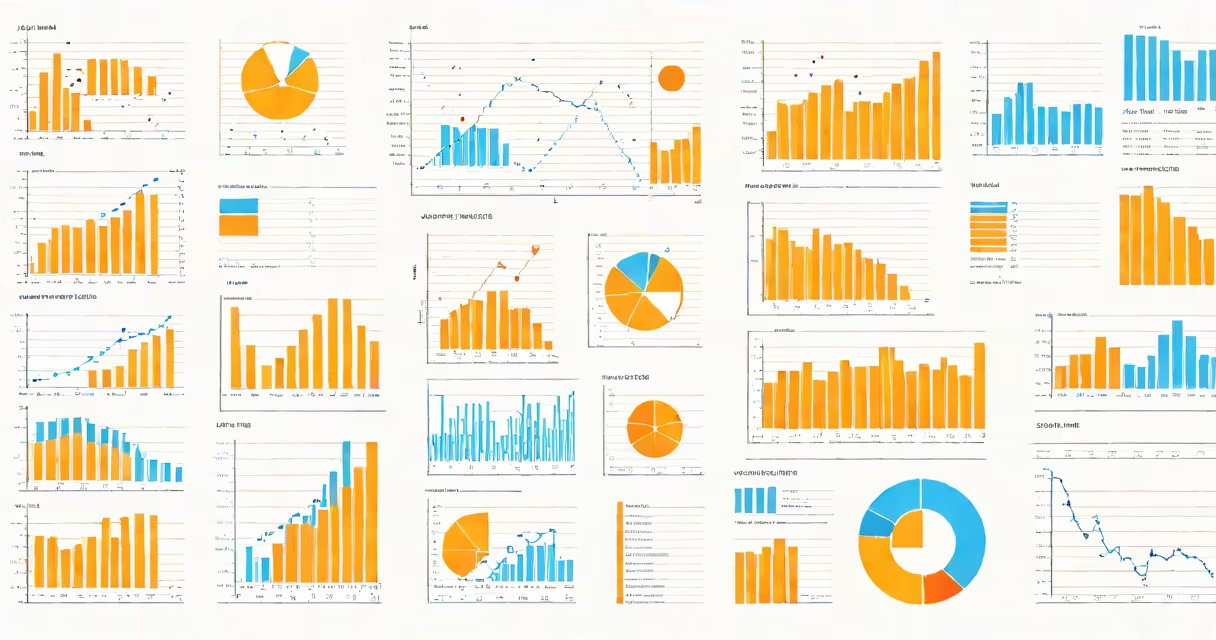
Quantitative data meaning refers to information collected in numerical form that can be measured, counted, or statistically analyzed. It enables objective evaluation through mathematical operations and is central to scientific research, business analytics, and policy development.
This type of data answers questions like "how many," "how much," or "how often." It is distinct from qualitative data, which captures descriptions, opinions, or attributes. Quantitative data allows researchers and analysts to identify patterns, test hypotheses, and make predictions using statistical tools.
For example, recording daily sales figures in dollars, measuring customer satisfaction on a 1-10 scale, or tracking website traffic in visits per hour all represent quantitative data. These numbers can be processed to reveal trends such as seasonal spikes in revenue or declining engagement over time.
Quantitative data relies on structured collection methods such as surveys with closed-ended questions, sensors, transaction logs, or experimental measurements. Once gathered, it is stored in formats like spreadsheets, databases, or data warehouses for processing.
Statistical techniques then extract insights. For instance, calculating the average monthly sales over three years reveals performance trends. Standard deviation shows variability-high values indicate inconsistent results, while low values suggest stability.
A real-world application: A retail chain uses point-of-sale systems to collect daily sales data across 50 stores. By aggregating this data, they calculate regional averages, identify underperforming locations, and adjust inventory based on demand forecasts.
Quantitative data falls into two main categories: discrete and continuous.
| Type | Description | Examples |
|---|---|---|
| Discrete | Countable whole numbers; no fractions between values. | Number of employees in a department (e.g., 12), number of defective products (e.g., 5). |
| Continuous | Measurable values that can include decimals and exist on a spectrum. | Weight (e.g., 68.4 kg), temperature (e.g., 23.7°C), time (e.g., 4.5 minutes). |
Understanding the difference matters because it determines which statistical tests apply. Discrete data often uses chi-square tests or binomial distributions. Continuous data supports t-tests, ANOVA, or regression models.
Another layer is measurement level: nominal, ordinal, interval, and ratio. Ratio data-like income or height-is the most informative because it has a true zero point. This allows meaningful ratios: $100 income is twice as much as $50.
Quantitative data is foundational in fields requiring precision and reproducibility. In healthcare, clinical trials measure outcomes like blood pressure reduction or recovery rates in patients receiving a drug versus placebo. Results are analyzed using p-values and confidence intervals to assess effectiveness.
In education, standardized test scores (e.g., SAT math scores ranging from 200 to 800) provide quantifiable benchmarks for student achievement. Schools use these numbers to evaluate program success, allocate resources, and compare performance across districts.
Businesses rely heavily on quantitative data for decision-making. A marketing team might run A/B tests on email subject lines, measuring open rates (e.g., 22% vs. 28%) to determine which version performs better. The difference is not just descriptive-it informs future campaigns.
Many assume quantitative data is inherently more accurate than qualitative data. This is false. While numbers allow statistical rigor, poor data collection methods-such as biased survey wording or unrepresentative samples-can produce misleading results.
For example, a company surveys 100 customers and finds 70% rate their service as "excellent." But if the sample includes only long-term users who are already loyal, the result doesn't reflect satisfaction. The data is numerical but invalid due to selection bias.
Another error is treating correlation as causation. If ice cream sales rise alongside drowning incidents during summer months, both are linked to warm weather-not because ice cream causes drownings. Quantitative data shows relationships, but context and design are needed to infer cause.
A tech firm wants to assess whether remote work improves productivity. They define productivity as "number of completed tasks per week" and track this metric for 120 employees over six months.
Data collection: Each employee logs task completion via a project management tool. Weekly totals are exported to a spreadsheet.
Analysis: Average weekly tasks are calculated for remote and office-based workers. Remote workers average 14.3 tasks/week; office workers average 12.1. A t-test confirms the difference is statistically significant (p = 0.018).
Conclusion: Based on this quantitative data, remote workers show higher productivity. The company adjusts its work policy accordingly.
This study didn't consider quality of work, employee burnout, or collaboration challenges-factors that require qualitative data. Quantitative data provides one piece of the puzzle, not the entire picture.
For instance, in data engineering, pipelines are built to ingest, clean, and change raw quantitative data from sources like IoT devices or CRM systems. These pipelines ensure data integrity before feeding into analytical models.
Even though quantitative data is numeric, it depends on clear definitions and consistent processes. Without proper governance, numbers lose meaning and trust.
I once helped design a dashboard for a nonprofit tracking food distribution. Initial reports showed a 30% increase in meals delivered. But upon inspection, the data was double-counting meals served at overlapping events. After fixing the logic, the actual increase was 12%. The numbers were correct-but the interpretation was wrong until we traced the data flow.
That experience reinforced a key principle: quantitative data meaning isn't just about the numbers themselves. It's about the process behind them-the definitions, the collection method, and the context in which they're used.
When evaluating quantitative data, ask: What does this number represent? How was it measured? Who collected it? And what assumptions underlie the calculation?
These questions ensure that quantitative data meaning leads to valid conclusions, not just impressive statistics.