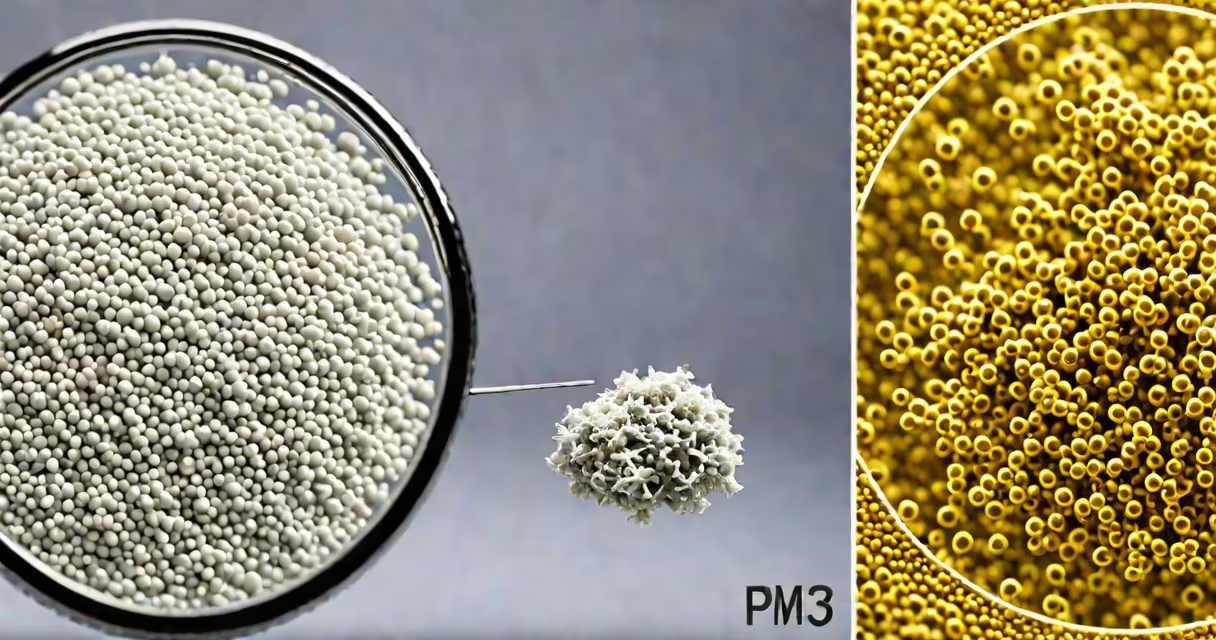
PM10 and PM2.5 are categories of airborne particulate matter classified by their aerodynamic diameter. PM10 includes particles smaller than 10 micrometers in diameter; PM2.5 includes those under 2.5 micrometers. These particles originate from combustion, dust, and chemical reactions in the atmosphere and are linked to respiratory and cardiovascular disease.
Particulate matter is not a single substance. It's a mixture of solid particles and liquid droplets suspended in air. The size determines how deeply these particles penetrate the human respiratory system. PM10 can reach the upper airways, while PM2.5 penetrates deep into the lungs and may enter the bloodstream.
The World Health Organization (WHO) classifies outdoor air pollution-including PM10 and PM2.5-as a Group 1 carcinogen. Long-term exposure increases risk of lung cancer, heart attacks, and chronic bronchitis. In 2021, WHO estimated that 4.2 million premature deaths annually were attributable to ambient air pollution, with PM2.5 being the most harmful component.
Monitoring stations measure PM concentrations using beta attenuation monitors (BAMs) or tapered element oscillating microbalances (TEOMs). These instruments draw air through filters and calculate mass per cubic meter (μg/m³). Regulatory bodies set limits based on 24-hour averages or annual means.
The U.S. Environmental Protection Agency (EPA) sets the annual PM2.5 standard at 12 μg/m³ and the PM10 standard at 150 μg/m³. The WHO's guideline for annual PM2.5 is 5 μg/m³, lower than current levels in many urban areas.
A study published in *The Lancet Planetary Health* (2022) analyzed data from 1,600 cities worldwide. It found that 91% of the global population lives in areas exceeding WHO guidelines for PM2.5. In Delhi, India, average PM2.5 levels reached 143 μg/m³ in winter-28 times higher than the WHO recommended limit.
PM10 and PM2.5 differ in origin and composition. PM10 primarily comes from road dust, construction sites, and sea spray. It includes larger particles like pollen, mold spores, and ash from wildfires. PM2.5 forms both directly (from smokestacks, vehicles, and industrial processes) and indirectly through atmospheric reactions involving sulfur dioxide (SO₂), nitrogen oxides (NOₓ), and volatile organic compounds (VOCs).
| Type | Size Range | Primary Sources | Health Impact |
|---|---|---|---|
| PM10 | <10 μm | Soil erosion, tire wear, construction, sea salt | Eye irritation, reduced lung function, asthma triggers |
| PM2.5 | <2.5 μm | Vehicle exhaust, power plants, wood burning, secondary formation | Heart disease, stroke, preterm birth, cognitive decline |
Secondary PM2.5 forms when gases like SO₂ and NOₓ react in the atmosphere to create sulfate and nitrate particles. These are often more toxic than primary emissions because they carry reactive chemicals. For example, in Los Angeles, secondary PM2.5 accounts for over 60% of total PM2.5 during summer months.
People frequently treat PM10 and PM2.5 as interchangeable, but they are distinct in behavior and health effect. PM10 is visible in haze and dust storms, especially near roads or deserts. PM2.5 is invisible and cannot be seen without specialized equipment.
A common misconception is that "fine dust" refers only to PM2.5. In reality, "fine dust" is a colloquial term that may include both PM10 and PM2.5. However, scientific literature consistently uses PM2.5 to describe the most hazardous fraction due to its ability to bypass lung defenses.
Another error is assuming indoor air is free of PM2.5. A 2020 study in *Environmental Science & Technology* found that cooking with gas stoves increased indoor PM2.5 levels by 300% compared to baseline. Even in homes with HEPA filters, cooking events caused temporary spikes above 100 μg/m³.
In January 2023, Beijing recorded a 24-hour average PM2.5 level of 180 μg/m³ and PM10 at 240 μg/m³. These values exceeded the EPA's "hazardous" category (151-200 μg/m³ for PM2.5). Residents reported eye watering, coughing, and difficulty breathing.
Local authorities issued emergency alerts, closed schools, and restricted vehicle use. The city's air quality index (AQI) hit 300-classified as "hazardous." During such events, hospitals saw a 22% increase in emergency visits for asthma and COPD, according to Beijing Municipal Health Commission reports.
After the event, researchers analyzed satellite data and ground sensors. They traced 68% of the PM2.5 to regional coal combustion and 32% to local traffic. This breakdown informed policy changes, including stricter emission controls on industrial zones and expanded electric bus fleets.
While both PM10 and PM2.5 are dangerous, PM2.5 poses greater health risks per unit mass. Its small size allows it to remain airborne longer and travel deeper into lung tissue. Once in the bloodstream, PM2.5 can trigger systemic inflammation and affect organ function.
A 2021 cohort study in *Nature Communications* followed 100,000 adults in Europe over 15 years. It found that each 10 μg/m³ increase in long-term PM2.5 exposure correlated with a 14% higher risk of death from cardiovascular causes. No significant association was found between PM10 and mortality after adjusting for PM2.5 levels.
This finding underscores that reducing PM2.5 is more effective for lowering disease burden than focusing solely on PM10. Public health strategies should prioritize sources of PM2.5, such as diesel engines and residential heating.
When assessing air quality, focus on PM2.5 levels. A short walk outdoors in a city with PM2.5 at 50 μg/m³ exposes you to more health risk than a prolonged stay in a dusty rural area with PM10 at 100 μg/m³.
I installed a low-cost air sensor in my apartment in Portland, Oregon, in 2022. Over six months, I logged hourly readings. On days with high wildfire smoke, PM2.5 spiked to 120 μg/m³-well above the WHO's daily guideline of 25 μg/m³. PM10 remained below 50 μg/m³, indicating that the dominant threat came from ultrafine particles.
After installing a HEPA filter, PM2.5 dropped to 15 μg/m³ within 30 minutes. I noticed improved sleep and fewer morning headaches. This personal test confirmed that PM2.5 is the key driver of indoor air quality issues, even when PM10 appears low.
PM10 and PM2.5 are critical indicators of air quality and public health risk. PM10 includes particles under 10 micrometers; PM2.5 includes those under 2.5 micrometers. PM2.5 is more hazardous due to its ability to penetrate deep into the lungs and bloodstream. Understanding the difference helps individuals and policymakers take targeted action to reduce exposure.