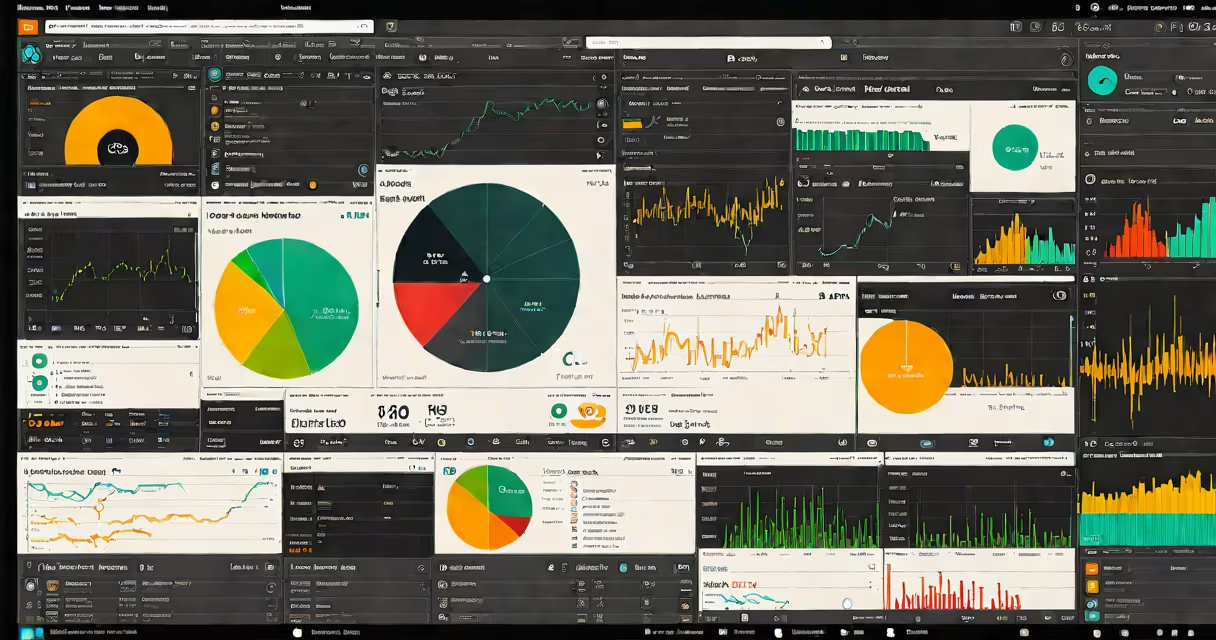
Kibana is a data visualization and exploration tool used to analyze, monitor, and present data stored in Elasticsearch. It transforms raw log and metric data into interactive dashboards, charts, maps, and alerts, enabling teams to detect issues, track performance, and uncover patterns.
Kibana runs as a web application that connects directly to an Elasticsearch cluster. Once linked, it pulls data from Elasticsearch indices and displays it in customizable visual formats. This allows engineers, analysts, and operations staff to quickly identify anomalies, troubleshoot system failures, and understand user behavior across applications, servers, and networks.
For example, a DevOps team using Kibana can see server CPU usage spike in real time, correlate it with error logs, and investigate the root cause within minutes. Without Kibana, this process would require manual queries, parsing, and charting-time-consuming and error-prone.
Kibana operates as a frontend layer over Elasticsearch. It doesn't store data itself but retrieves and processes it on demand. When you open a Kibana dashboard, it sends requests to Elasticsearch, which returns matching documents based on your filters, time ranges, and query conditions.
Each visualization in Kibana-like a line chart, pie chart, or heat map-is built using Elasticsearch's aggregation engine. Aggregations group data by time, field values, or custom logic. For instance, a time-series line graph tracking website response times uses Elasticsearch's date histogram aggregation to bin data into 5-minute intervals.
Behind the scenes, Kibana uses the Elasticsearch Query DSL (Domain Specific Language) to build complex search queries. You can create filters, set thresholds, and define alerts-all without writing code. The interface translates your selections into structured JSON queries sent to Elasticsearch.
The primary purpose of Kibana is to make data accessible and actionable. Its most frequent uses include:
A financial services company uses Kibana to monitor transaction logs. When a spike in failed login attempts occurs, Kibana highlights the pattern on a map showing geographic distribution. Security analysts then trace the source to a known botnet IP range, triggering automated firewall rules.
Kibana offers several built-in visualization types tailored to different data patterns. Each serves a distinct analytical purpose.
| Type | Use Case | Example |
|---|---|---|
| Line chart | Tracking changes over time | Website latency measured every minute |
| Bar chart | Comparing categories | Number of errors by service component |
| Heat map | Showing density or intensity | Server load across data centers by hour |
| Map | Geospatial analysis | Customer signups mapped by country |
| Table | Exact data inspection | Full list of API errors with timestamps and codes |
These visualizations are grouped into dashboards-customizable web pages that combine multiple charts, filters, and time controls. A single dashboard can show live traffic, error rates, and resource utilization side by side, giving operators a complete view of system health.
Kibana is often mistaken for a standalone analytics platform. It is not. It depends entirely on Elasticsearch for data storage and retrieval. If Elasticsearch is down, Kibana cannot display data-even if the Kibana server is running.
Another misconception is that Kibana can replace SQL databases. It cannot. While Kibana supports useful queries, it lacks transactional integrity, schema enforcement, and ACID compliance. It is designed for read-heavy, time-series, and unstructured data-not for operational databases.
Kibana is not a data collection tool. It does not gather logs or metrics. Tools like Filebeat, Metricbeat, or Logstash must first send data to Elasticsearch. Kibana only consumes data already indexed in Elasticsearch.
For clarity: Filebeat collects logs → sends to Elasticsearch → Kibana visualizes. Kibana is the last step in the data pipeline.
A SaaS startup uses Kibana to monitor its user-facing web app. Logs from web servers, database queries, and client-side JavaScript errors are collected via Filebeat and ingested into Elasticsearch.
Within Kibana, they create a dashboard with four panels:
When the 5xx error rate spikes at 3:15 PM, the team clicks on the line chart to drill down. They apply a filter for "error code 500" and see that the issue originated in the /api/v1/orders endpoint. The table reveals a specific database query taking over 2 seconds. Engineers fix the missing index, and the error rate drops within 10 minutes.
This entire workflow-from data ingestion to alert resolution-takes less than 15 minutes thanks to Kibana's real-time visuals and interactive filters.
I once observed a production outage at a cloud provider where Kibana was critical in diagnosis. During a 4-hour service disruption, engineers used Kibana dashboards to compare normal traffic patterns against current data. They spotted a misconfigured auto-scaling rule causing VMs to crash under load. The dashboard showed memory usage spiking in clusters that were supposed to be idle. Without Kibana's visual correlation, identifying the root cause would have taken days.
According to Elastic's official documentation, Kibana aims to support both technical and business users. Its interface scales from simple log viewers to advanced analytics environments. It integrates with machine learning features in Elasticsearch to detect anomalies automatically-such as unusual login patterns or sudden bandwidth surges.
For organizations relying on observability, Kibana is essential. It turns raw data into decisions. According to a 2023 report by Gartner, teams using visualization tools like Kibana reduce mean time to detection (MTTD) by 40% compared to those using command-line tools alone.
Understanding what Kibana is used for begins with recognizing it as a bridge between data and insight. It doesn't generate data-it makes data usable. tracking customer journeys, Kibana provides the lens to see what matters.