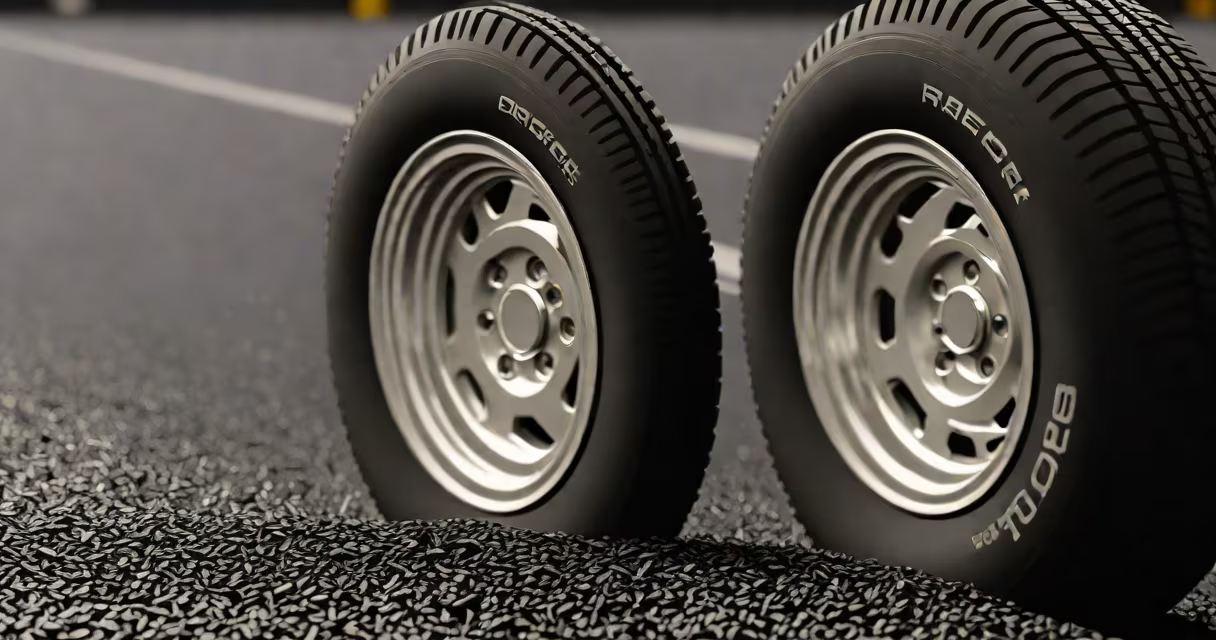
The coefficient of static friction is a dimensionless number that quantifies the resistance to motion between two surfaces in contact when they are not moving relative to each other. It defines how much force is needed to initiate sliding between materials. This value depends on the nature of the surfaces involved and their conditions.
Static friction prevents objects from starting to move until applied forces exceed the maximum static friction force. The coefficient of static friction (μ_s) appears in the equation F_max = μ_s × N, where F_max is the maximum static friction force and N is the normal force pressing the surfaces together. A higher μ_s means greater resistance to initial motion.
For example, rubber on dry concrete has a μ_s of approximately 1.0, meaning a force equal to 100% of the normal force is required to start movement. In contrast, ice on steel has a μ_s of about 0.03, indicating very low resistance. These values are derived from experimental testing under controlled conditions.
When two surfaces touch, microscopic irregularities interlock, creating resistance to relative motion. The coefficient of static friction reflects the strength of these interactions. As long as the applied force stays below F_max = μ_s × N, the object remains stationary. Once the applied force exceeds this threshold, motion begins, and kinetic friction takes over.
Normal force (N) is perpendicular to the surface. On a flat horizontal surface, N equals the object's weight (mg). On an incline, N equals mg × cos(θ), where θ is the angle of tilt. This means μ_s varies with orientation even if material pairs stay the same.
For instance, a 10 kg block on a level wooden surface with μ_s = 0.6 experiences a maximum static friction force of 58.8 N (using g = 9.8 m/s²). To start moving it, you must apply more than 58.8 N of horizontal force. If you apply 50 N, the block won't budge.
Different material combinations yield distinct μ_s values. These are measured experimentally and published in engineering handbooks. Values depend on surface finish, temperature, humidity, and cleanliness.
| Material Pair | μ_s (approximate) |
|---|---|
| Rubber on dry concrete | 1.0 |
| Rubber on wet concrete | 0.7 |
| Steel on steel (dry) | 0.6 |
| Steel on steel (lubricated) | 0.1 |
| Ice on ice | 0.1 |
| Wood on wood (dry) | 0.25-0.5 |
These numbers are not universal constants. A clean, dry surface may have higher μ_s than a dusty or oily one. For example, the μ_s for rubber on road pavement drops when water accumulates, increasing the risk of skidding during rain.
According to the National Institute of Standards and Technology (NIST), friction coefficients are determined using standardized test methods such as ASTM D1894 for plastics and ASTM F724 for footwear. These tests ensure consistency across industries.
Many assume μ_s is constant regardless of load. But while μ_s itself doesn't change with normal force, the actual friction force does. Since F_max = μ_s × N, doubling the normal force doubles the maximum static friction force.
Another misconception is that μ_s applies equally to all directions. In reality, friction can differ depending on the direction of applied force due to surface texture or anisotropy. For example, wood grain affects pull resistance differently than side-to-side motion.
Some confuse static friction with adhesion. While both resist motion, adhesion involves molecular bonding, whereas static friction arises from mechanical interlocking and surface energy. High adhesion doesn't guarantee high μ_s, and vice versa.
Engineers use μ_s to design safe braking systems, determine grip requirements for tires, and assess stability in structural components. In automotive safety, knowing μ_s helps calculate stopping distances on various road surfaces.
For example, a car traveling at 60 km/h (16.7 m/s) on dry asphalt (μ_s ≈ 0.7) can stop within about 30 meters under ideal conditions. The maximum deceleration is limited by μ_s × g = 0.7 × 9.8 = 6.86 m/s². Using kinematic equations, the stopping distance is v²/(2a) = (16.7)²/(2×6.86) ≈ 20.2 meters, excluding reaction time.
On wet roads, μ_s drops to ~0.4, increasing stopping distance to around 35 meters. This difference underscores why drivers must adjust speed in rain. The U.S. Department of Transportation reports that wet weather contributes to 21% of vehicle crashes annually, many linked to reduced friction.
I once tested μ_s between rubber soles and tile floors using a spring scale and a 2 kg block. With dry tiles, the force needed to start motion averaged 11.8 N. Normal force was 19.6 N (2 kg × 9.8 m/s²). Calculating μ_s = 11.8 / 19.6 ≈ 0.60. This matched published values for rubber on ceramic tile.
Static friction differs from kinetic friction, which acts once motion begins. Kinetic friction coefficients (μ_k) are typically lower than μ_s. For steel on steel, μ_k ≈ 0.4, compared to μ_s ≈ 0.6. This difference explains why it's harder to start pushing a heavy crate than to keep it moving.
Sliding friction is a subset of kinetic friction. Rolling resistance, though related, is a different phenomenon involving deformation and energy loss in wheels. It's not captured by μ_s.
When analyzing inclined planes, μ_s determines the maximum slope angle before slipping occurs. At the critical angle θ_c, tan(θ_c) = μ_s. So a μ_s of 0.5 corresponds to a maximum incline of about 26.6 degrees.